How to use USCHO Pivot Stats
USCHO Pivot Stats tool is based on similar principles as a pivot table in spreadsheets.
Step 1: Pick a dataset
You start by picking the dataset to analyze by clicking on the big buttons at the top. USCHO has three datasets at this time.

- Player Scoring Stats – Scoring stats including such measures as faceoffs, blocked shots, shots, goals and assists at the player game level.
- Player Goaltender Stats – Goaltender stats including such measures as saves, shots, goals allowed and goaltender decision (wins, losses and ties).
- Team Stats – Goals at the time level including a special field called Game time class, which classifies a goal as in the first 2 minutes of a period, last 2 minutes of a period or the middle of a period.
An Example using Game time class:
https://stats.uscho.com/pivotstats/division-i-men/team/4e3ef01a073f87451df9de9b0387ed65ff85bce9
You next need to drag fields between the rows, columns and values (what you are trying to analyze). The data will refresh showing your result.
We recommend you run the example by selecting it from the saved configuration dropdown menu to the right of the Team Period Stats button.
How do I get rid of a column I don’t want anymore?
Just drag it back up to the available fields.
How do I start over with my config?
Just hit the Reset Config Button.

What’s the Values header?
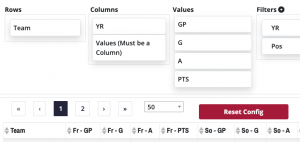
It places all the value fields in columns and allows you to put fields before or after. The result will be a loop through the value of the field and all its values displaying the first value field. Then loop through the second field value…
Notice how it loops through goals, assists and points for freshmen before going to sophomores:
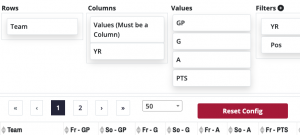
And if we drag YR (player’s year) below values:
How do I filter the results by a field?

- To add a new filter click the circle + to the right of Filters
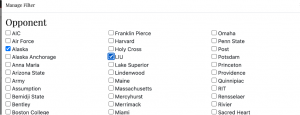
- A window will pop up. Select a field from the dropdown and select the check boxes you want to see data for. The filter below would do stats for games against Alaska and LIU:

- A window will pop up. Select a field from the dropdown and select the check boxes you want to see data for. The filter below would do stats for games against Alaska and LIU:
- To edit a filter click the pencil icon. A window will pop up.
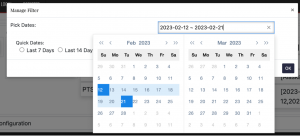
- Dates have special options to pick by data range: Or you can preselect date ranges of the last seven, 14 or 28 days.

How do I see the detail behind the data?
If you click on a row it will drill down and show you raw data for that row. Click the Back button to return to the list.
How do I save a configuration?
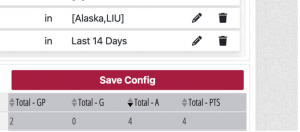
Hit the Save Config button. A window will pop up where you add a title. Hit the save button. The URL will change to include a unique string.
https://stats.uscho.com/pivotstats/division-i-men/scoring/4ae014dd8335bac467c31ad7630c41c75fb68b70/
You can bookmark that URL to return or share it.
Why does my save config not show in the dropdown after I come back?
The dropdown is a list of saved configurations USCHO has flagged for everyone to see. You need to bookmark your save config. It will get added to the dropdown until you change datasets or refresh.
How do I download the results as a spreadsheet?
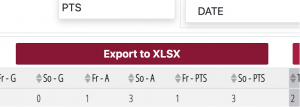
Click the Export to XLSX button. It will show a download button.
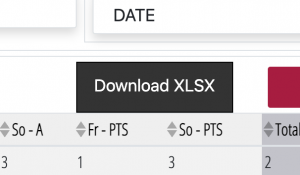
The file will show in the downloads for your browser.

The tool is hard to use on a mobile device.
Unfortunately, this kind of tool is not well suited for a phone. If you have a saved link it will use a responsive table you can slide right and left.
I don’t see a field I am looking for.
This is a brand new tool. We will be adding fields and features in time. You can request an upgrade by sending a request via the helpdesk. Requests will help us prioritize fixes.
https://www.uscho.com/ncaa/report-a-site-problem/
Something is not working.
You can report an issue by sending a request via the help desk.
https://www.uscho.com/ncaa/report-a-site-problem/

