

Sure, preseason polls can be inaccurate, but the reason might surprise you.
Spoiler alert: it’s not that voters are wrong, really.
It’s that they don’t agree yet.
First, a word about preseason polls generally.
Contrary to grumblings from some fans, early-season polls actually resemble end-of-season polls quite closely, especially in Division I men’s hockey. Over the last decade, about two-thirds of teams in the USCHO.com preseason poll (about 14 of 20) were still in the poll in the first week of March. Also, of the preseason’s top 10 teams, about eight (82 percent) stayed in the poll at the end of the season. On average, three of the top five teams were still in the top 10.
Preseason polls seem inaccurate only in comparison to midseason polls. Of course, that midseason polls better resemble end-of-season polls should come as no surprise, but the resemblance is striking: during the last decade, about 17 teams in the poll in the first week of January remained in the poll in early March. Almost all (94 percent) of the teams in the top 10 in January closed out the year in the poll generally. Also, unlike the preseason polls, where three of the top five teams were in the top 10, about 3.5 of the midseason top five stayed in the top five.
The accuracy of preseason polls might surprise some fans, but so would the reasons for their inaccuracy. Those reasons have less to do with rankings themselves and more to do with the point totals that determine those rankings.
The USCHO.com poll amasses point totals for teams based on the opinions of 50 individual voters, usually coaches and sportswriters. Each voter creates a 20-team poll each week, and scores for each team are assigned based on rank: the top spot gets 20 points, and the 20th spot gets one point. So, a unanimous No. 1 team would amass 1,000 points (50 voters times 20 points).
Obviously, teams are ranked based on the number of points they receive, but importantly, there is no set point total necessary to appear in the poll, or even to get the top spot in the poll. Also obviously, rankings are all relative to one another, but that means that a team’s ranking depends on how the votes are distributed across the 60 teams in Division I hockey. The same point total can earn a different ranking week to week, or especially month to month, depending how many other teams got votes, and how many votes they got.
Focusing on points in this way can shed some light on why polls can differ throughout the season. Specifically, we can distinguish between two reasons for “error” in the preseason poll:
1) Do voters generally agree about the rankings of teams early in the year, perhaps because they were too reliant on the previous year’s results, only to realize they were wrong as the season progresses?
2) Do voters generally disagree about the rankings early in the season, and simply build consensus throughout the season?
For reasons that will become clear, point totals would be distributed differently throughout the polls in these two cases.
First, let’s look at the distribution of teams that get votes at all.
At the bottom of every poll is the “Others Receiving Votes” category, which includes teams who were on some voters’ ballots, but did not earn enough votes to crack the top 20 teams. Over the past decade, the poll during the first week of March had an average of just under seven teams in the Other category. In the first week of January, a slightly but significantly higher number of teams — about nine — got votes outside the poll. Including the 20 teams in the poll, then, the total number of teams receiving votes decreased from 29 to 27 from January to March, suggesting that voters were homing in on the best teams as more games were played.
The preseason is a different story. The average number of Other teams in the preseason poll over the past ten years is over 17 — about double the numbers later in the year. Early in the season, then, voters spread their votes over a significantly larger number of teams: the total number of teams receiving votes is 37, about a third more than the numbers later in the season, and about twice the number of teams that make the official poll.
Those “Other” schools get more votes in the preseason, too. The top “Other” school at the end of the season—the school that is just barely left out of the poll — averages about 42 votes, but the top “Other” team in the preseason averages over double that number, in the high 80s.
Interestingly, that high of a vote total would be good enough for a No. 20 ranking in both January and March.
The fact that the preseason poll includes double the number of “Other” teams, coupled with the fact that many of those “Other” teams receive relatively high point totals, demonstrates that voters vote for a lot of different teams early in the season. It’s not a trivial artifact, either, where a lot of different teams just get a last-place vote or two — some of these teams receive point totals that would earn them rankings at other times of the year.
If votes are being spread over a wider number of teams in the preseason, then the total numbers of points for each team in the whole poll should be lower, as well. Alternatively, maybe voters agree about the top few teams in the poll, and the bottom half of the poll is a free-for-all, which explains why so many teams receive votes. Analyzing the number of points from the top to the bottom of each poll can provide the answer.
When viewing polls in terms of points, it is helpful to compare polls to a gold standard—a hypothetical “consensus poll”—where all 50 voters vote in total agreement. In such a poll, the team in the top spot would receive 1,000 points, the No. 2 spot would have 950, and No. 3 would have 900. Also, the No. 20 spot would have 50 points, and there would be no “Others Receiving Votes” category. This hypothetical, unanimous poll can serve as a benchmark to measure the level of agreement between voters at different points in the season.
As one might expect, polls at the end of the season closely mimic this hypothetical, unanimous poll, nearly from top to bottom. Over the past ten years, the top school during the first week of March earned a total of about 991 points, compared to 1,000 in the case of consensus. The No. 10 team, which would ideally earn 550 points, earned 556. Finally, the No. 20 team earned 76 points, compared to 50. These numbers border on full agreement among voters, with vote totals closely tracking to the unanimous case.
Voters are similarly in agreement during the middle of the season. Over the last decade, the No. 1 team in early January averaged 982 points (out of 1,000). The No. 10 team got 531, compared to 550 in the unanimous case. The No. 20 team earned 82 instead of 50. These numbers help explain why the rankings of the polls align so closely at the middle and the end of the regular season: if voters are near consensus by early January, they will probably continue to agree with one another for the next couple of months.
The preseason poll, however, shows much less agreement. The preseason favorites over the past ten years have averaged 927 votes, compared to 1,000 in the unanimous case. The No. 10 team got 497 out of the 550 that we would expect in our hypothetical example. The No. 20 team got 112 instead of 50. Unlike the January numbers, these totals are significantly different, statistically speaking, than the totals in March.
(To be sure, some voters do not submit full ballots, or even vote at all, for every poll, especially preseason polls. However, correcting for the number of voters in each poll does not change this general pattern. The differences between polls decrease slightly, but the polls are still different in the same general way(s), and statistically significantly so. The raw numbers are given here, because that’s what’s published, and that’s what the fans see.)
Graphing the point totals in each poll gives more evidence for a lack of consensus among early-season voters. The figure below represents the total number of votes received at each position in the poll. However, for simplicity, the hypothetical case of full consensus is represented as “0” at each poll position (dotted line). The point totals for each poll position in the preseason (black), midseason (gray) and end-of-season (light gray) polls are then compared to the unanimous case. Directly contrasting each poll position with a hypothetical consensus reveals striking patterns throughout the year.
Over the past ten years, all of the top ten spots in the preseason polls got significantly lower point totals than the hypothetical case of consensus (black line vs. dotted line). In addition, all of the top positions in the preseason poll received significantly lower totals than the same positions later in the year (gray lines). As the different curves show, the point totals for most spots in the rankings approach the hypothetical case of full consensus as the season progresses.
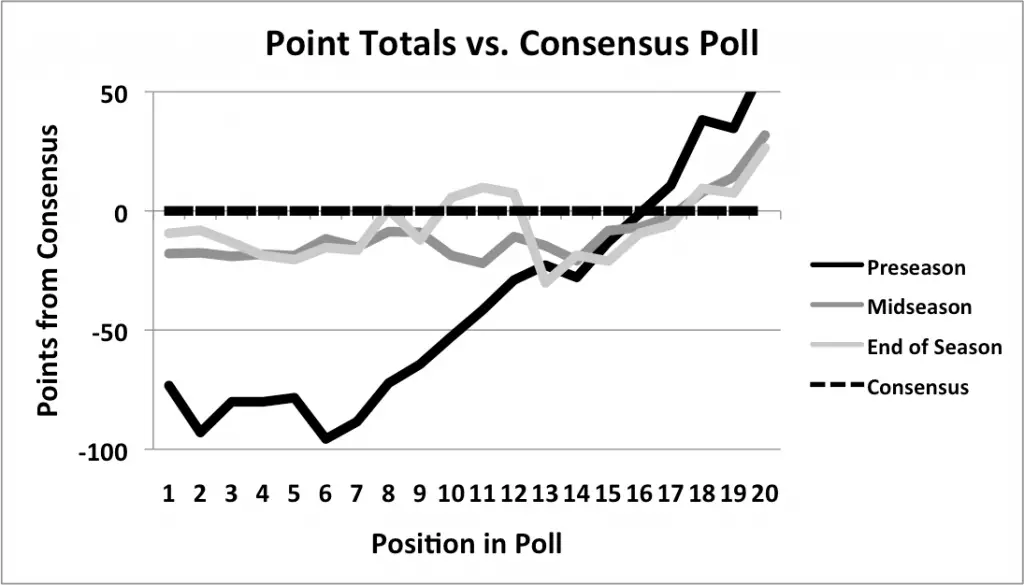 Interestingly, just as the top poll positions have point totals below the unanimous case (left half of figure), the lower poll positions have point totals above the unanimous case (right half of figure). Some of this is simply a byproduct of the arithmetic: the top team literally cannot go above the hypothetical point total of 1,000 points, and most realistic scenarios would result in similarly low numbers for other top spots in the poll. However, if voters were in general disagreement about which teams belonged in the poll at all, they would spread their votes among a large number of teams, including a large number of Other teams, which would decrease all vote totals below the unanimous case.
This is not what we see.
Instead, teams in the bottom half of the poll start accruing more votes than the unanimous case would predict, as if to compensate for the relatively low totals near the top of the poll. This suggests that many teams near the bottom of the poll are receiving votes corresponding to higher positions within the poll. Therefore, it seems that voters generally agree on which teams belong in the poll at all, and vote predominantly for the same twenty teams, even if they disagree about their order.
The preseason poll shows both of these trends. As discussed, the preseason poll allocates a higher percentage of its votes to “Other” teams. The poll compensates by having significantly lower totals for its top teams (see left side of graph). However, a spike remains above the unanimous case in the bottom half of the poll, suggesting there is still significant overlap between voters’ ballots, which is unsurprising. In fact, it would be worrisome if it were not the case.
In short, preseason polls are different than other polls during the year, in no small part because voters have not yet narrowed the field of the top 20 teams. As a result, more teams accrue points, and do so in significant numbers, resulting in a larger pool of Others Receiving Votes.
Also, the greater number of teams receiving votes means that top poll positions receive fewer votes, and therefore might be less meaningful than later in the season. Indeed, preseason polls commonly include first-place votes for teams in the bottom half of the top ten, even while some top five teams get no first-place votes at all. Also, lower vote totals in the poll can mean that differences between rankings may be trivial, at least compared to the end of the year.
Importantly, though, this preseason scenario of widespread uncertainty is different than the often unspoken assumption among fans, who seem to think that preseason voters vote in unison about the wrong teams, only to be proved wrong as the season progresses. Sure, this isn’t entirely inaccurate—as we see every tournament season, no poll is perfect. With that said, much of preseason polls’ inaccuracy probably stems from voters’ casting a wide net with their votes, as opposed to their putting too much stock in the previous year, or sharing delusions in unison.
So, what do preseason rankings mean? The top of preseason polls might include teams that most voters think are merely decent. Because the overall point totals for each poll position are so low in the preseason, a bunch of middle-tier votes might be enough for a high ranking early on, even if that same point total would be more unimpressive later in the year.
In short, being No. 1 in October means a lot of people think you’re good; being No. 1 in March means everyone thinks you’re the best.
The key to understanding preseason polls seems to be points, not the rankings themselves. The next time you hear grumbling about how a team is ranked in the preseason, consider the source. It’s probably just a rank-and-file fan.
Comments are closed.