Minnesota Duluth plays Notre Dame in the national championship game of the 2018 Frozen Four at the Xcel Energy Center in St. Paul, Minn. (photo: Jim Rosvold/USCHO.com).College hockey’s national tournament has seen a surge of underdogs in recent years.Yale (2013) and Providence (2015) won it all despite never being favored in a single tournament game. This past year, Minnesota Duluth won the national title after narrowly getting into the tournament with the last at-large bid.For many fans and sportswriters, these three champions have come to represent the new normal in college hockey. A sport that was dominated by a handful of programs for most of its history is now perceived to be a free-for-all.Or, at least, a free-for-many.The word “parity” has been tossed around to describe this new status quo, raising the question whether success in college hockey has actually become more widespread, and to what extent. If parity has increased, the next question is whether it will continue to increase, or if we instead have achieved “peak parity.”To answer these questions, this article analyzes results from the history of college hockey’s national tournament.When college hockey crowns its national champion these days, how wide open is the field? Is the perceived parity real, and how much more of it can we expect?The simplest measure of parity is the number of teams that are winning. To start, we can ask how many different hockey programs have appeared in the national tournament’s final weekend, the Frozen Four.Measured this way, parity is at an all-time high.The last decade’s worth of Frozen Four participants — 40 teams over ten years — have come from 23 schools. For each of the past seven years, that number has been in the low 20s. Before then, the record of 20 had stood since it was set in the early 1990s (Figure 1).To be sure, some schools still reappear in the Frozen Four. Eleven teams have appeared more than once in the past decade, which is not uncommon: That number has hovered around ten for the history of the tournament.However, because more teams have made it to the Frozen Four in recent years, the schools that have made repeat appearances have done so less often. Today, schools with multiple appearances average about 2.5 appearances per decade, compared to an average of over four appearances per decade just ten years ago (Figure 2). In short, just as many teams are reappearing in the Frozen Four, but they are reappearing less often as the number of newcomers increases.Parity is also obvious over the previous five years instead of the whole decade. The twenty squads that appeared in the Frozen Four over past five years were from fourteen different schools. This is atypical historically: The number of participating schools over a five-year period has been at unprecedented levels for most of the past few years, including the record of eighteen different schools set five years ago (Figure 3).Parity is not unprecedented, however, when we shift our focus from the number of Frozen Four teams to the number of championship teams. The ten most recent championships were won by eight different schools. Having only two repeat winners may seem like a surefire indicator of parity, but it is relatively common. Historically, 14 different ten-year periods included at least eight different champions, equating to about one quarter of the time (Figure 4). The same can be said over a five-year timeframe: The last five years have seen perfect parity, or five different champions, but that also has happened about one-quarter of the time over the history of the tournament (Figure 5).In other words, fans of college hockey are right to note that, regarding the number of teams winning championships, parity is indeed high. However, that high level of parity itself–eight different champions in ten years, and five different champions in five years — is not uncommon historically. Even college hockey’s current streak of seven consecutive championships won by different schools (2012-2018) merely mimics an identical streak 30 years ago (1984-1990).Measured in these ways, today’s parity is real, but it is not new.But what about the rankings of those champions?Recent champions Yale, Providence and Minnesota Duluth were all underdogs, regardless if they had qualified for previous national tournaments. This is a different kind of parity, with a focus on underdogs in the short term rather than the dominance of dynasties in the long term.To measure this kind of parity, rather than counting the number of schools that win over time, we can record the rankings of the teams that win each year. By this measure, we can see that, again, parity may indeed be on the rise, but we are not quite at peak parity.As a review for more casual fans, the NCAA men’s tournament includes 16 teams divided into four regions. Each region serves as a mini-tournament, with teams ranked one through four. As is typical, the highest seed plays the lowest seed in the first round, meaning the other first-round game is between the second and third seeds. The two winners of these first-round games then square off in the second round to decide who represents the region in the Frozen Four.One obvious place to start an analysis of parity is the tournament’s first round, in no small part because the pairings of the high and low seeds makes for some of the most stunning upsets. In the 16 years since the adoption of the current 16-team format, the 64 regional one-seeds are 43-21, or win about two-thirds of the time (67%). Two-seeds in the regions are 38-26 (59%). (This lower winning percentage makes sense, as the games between the second and third seeds are typically closer matchups.)These records demonstrate that the outcome of the first round of the national tournament is not easy to predict, just as many fans and sportswriters have noted. However, a closer look at the regional seeding of the teams that advance reveals just how close we are to parity.One-seeds are the most likely to emerge from the region and go to the Frozen Four, but in a fictional system with complete parity, just as many four-seeds as one-seeds would emerge over time. This would result in a random set of teams advancing to the second round, and the average rank of these second-round teams would be 2.5 (i.e. [1+2+3+4]/4 teams).We can compare this hypothetical average to the average that we have actually seen in the tournament to determine if the current system is distinguishable from complete parity. Similarly, we can compare the average ranks of teams that actually advance to the average ranks in a hypothetical system with no parity, in order to see if the current system is statistically different from a system where the favorites always win.In a system with no upsets, where every first and second seed made it to the second round, the average rank of second-round teams would be 1.5. Since the adoption of the current tournament format, the average rank of second-round teams has been 2.2, and has wavered between 2.0 and 3.0 for most of that interval (Figure 6). This average is statistically different than 1.5, meaning that we clearly have a system with some parity.However, the current system is also distinct, even if less clearly so, from a system with perfect parity.As mentioned, perfect parity would mean that the average rank of second-round teams would be 2.5, and the full 16 years’ worth of data shows that our system is different than perfect parity. However, similar statistical tests on subsets of years of the tournament (especially subsets of years after, say, fourth-seeded Holy Cross broke the tournament mold by stunning top-seeded Minnesota in 2006) give results that are less clear. (More technically, several tests are not significant at the traditional p<0.05, and the results flirt with the rather forgiving threshold of significance of p<0.1.)In short, because statistical tests give results that fall into a gray area of interpretation, fans and sportswriters are not unreasonable in concluding that the system has resembled "peak parity," at least in recent years. The first round can reasonably be described as a game of roulette, even if not a perfectly fair game.But that game ends in the second round. Since the adoption of the 16-team format, the average regional seed of teams that move on to the Frozen Four is 1.9. This is statistically different than the 1.0 we would see if every winner were the favorite from each region, but it is also statistically different than the 2.5 we would see in a system with a random selection of winners from each region.Further, this average has been ticking downward over the past decade, meaning that teams with better seeds have been appearing in the Frozen Four (Figure 7). Seeding is still a predictor of success deep into the tournament, even if to a lesser extent than fans expect.A similar look at the regional seeding of the national champions also shows that college hockey is not at "peak parity." Since the adoption of the sixteen-team tournament format, the majority of champions have been one-seeds in their regions (nine of sixteen years), but the average rank of the champion is also 1.9, which is again statistically higher than 1.0 but lower than 2.5. Being a favorite in college hockey still correlates with winning championships, even if less so than in other sports.Taken together, all of these statistics paint a picture of increasing, but not peak, parity. Fans and sportswriters are correct in saying that parity is at unprecedented levels in college hockey, especially during the national tournament's first round, and even regarding which teams play on the sport's final weekend. They would also be correct in saying that many schools have a shot at the national title.In terms of the later stages of tournament, however, a team's ranking remains a predictor of its success, even if more weakly than before. The field is not wide open.Not yet, anyway.So, the first round has become almost unpredictable, and more teams are making it to the Frozen Four. Why are more teams not winning the championship? At least two reasons come to mind, and neither is particularly surprising.First, the number of teams winning championships may already be near saturation. Eight different schools winning championships over ten years is a high number, and to expect it to go much higher may be unrealistic. After all, asymmetries will always exist across college hockey, both in terms of personnel (e.g. talent of players and coaches) as well as infrastructure (e.g. facilities and support from alumni).These short- and long-term imbalances will inevitably produce a handful of favorite teams in any given year. To expect zero repeat winners among favorites over a decade may be far-fetched--indeed, we have never seen zero repeat winners in any ten-year span of the tournament.As more evidence, consider that the number of different champions in college hockey has been relatively high for 30 years. Over the history of the national tournament, an average of between six and seven schools have won championships per decade. However, the last time that number dipped below six, Gretzky was playing in his first Stanley Cup final, and Reagan had won the most recent presidential election -- against Carter. As measured by distribution of championships, college hockey may indeed be at the closest approximation of "peak parity" that one could expect, and may have been for some time.Second, the recent increase in the number of teams in the Frozen Four closely mirrors the recent increase in the number of teams in the national tournament itself. The number of schools appearing in the Frozen Four, or the national semifinals, is unprecedented today, but that number started to climb into record-breaking territory only after the national tournament expanded to a 16-team field in 2003.Contrast this expanded field with the very early days of the tournament, which included only the national semifinals and final, just like today's Frozen Four. In that initial tournament format, the first two years included the same four schools, and the first three years included a total of just five schools. (This phenomenon has occurred once since then, during the mid-1970s.) One program, Michigan, appeared in the first ten national semifinals, winning six championships. During that span, Colorado College appeared seven times and won twice, while Boston College appeared five times and won once.Those early days were in stark contrast to the current 16-team format, which in its sixteen years has seen seven champions that were not even ranked in the top four teams. That is, about half of the time since the 16-team format was adopted, the eventual champion would not have made the field in the original four-team format. Of course, the national tournament dispensed with the four-team field long ago, but suffice it to say that allowing more teams into the tournament inevitably results in more semifinalists, finalists, and champions over time.Because Division I college hockey has only 60 teams, perhaps it should come as no surprise that parity has increased when about one quarter of the teams now make the national tournament, and a single-elimination tournament, at that.The effect of an expanded field is being felt well outside of tournament time, as well. Consider recruiting. To be sure, modern-day recruiting would be unrecognizable to players and coaches from the early days of college hockey, and for a variety of reasons (e.g. year-round hockey and exposure via camps and the Internet), but the expanded tournament field may also contribute to shifts in the recruiting landscape. Because more schools have the prospect of playing in the national tournament, talented players may be more likely to choose a less iconic program if, say, they could see more playing time early in their careers or if the program were closer to home.All of these factors in recruiting may have led to a wider distribution of talent across the sport, and that trend may be snowballing as more teams advance deep into the national tournament.All of this brings us back to the three recent underdog champions. For some, the Friars from Providence and the Bulldogs from Yale and Duluth have become examples of parity in college hockey, and rightly so. But even if they are no longer the exception, they are not yet the rule. Six championships in the last ten years have been won by teams that were top seeds in their regions. Also, most of those top teams were from iconic programs in the sport.Of course, the exceptions to the rule may be appearing more frequently. The champion between Yale and Providence was indeed a one-seed, but hailed from a school that had never won a national title. Or played for one, for that matter. Union seemed to come out of nowhere earlier this decade, at least in terms of historical success.More evidence of parity, perhaps. The ice continues to level.Figure 1:Figure 2:Figure 3:Figure 4:Figure 5:Figure 6:Figure 7:P. A. Jensen is a freelance sportswriter and editor of RuralityCheck.com. He lives in northern Minnesota with his wife and son.

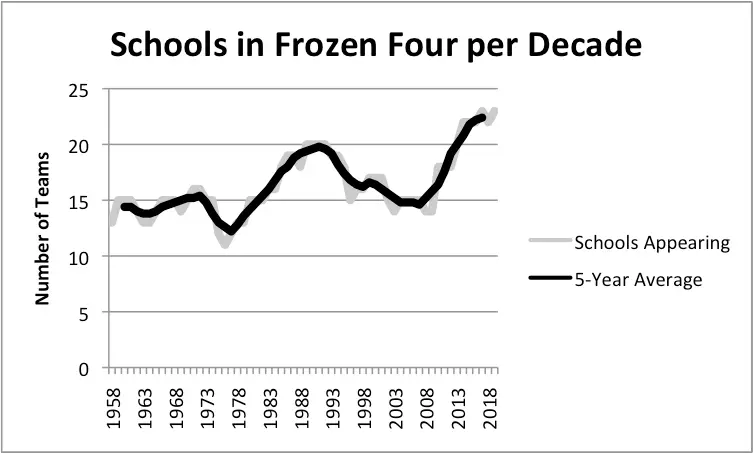 Figure 2:
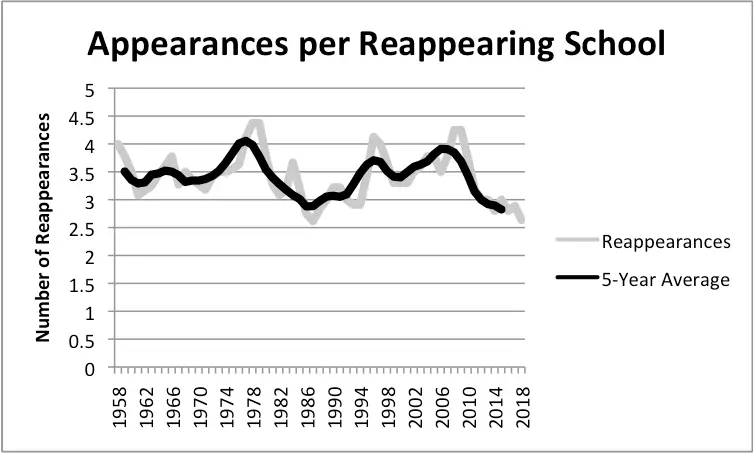 Figure 3:
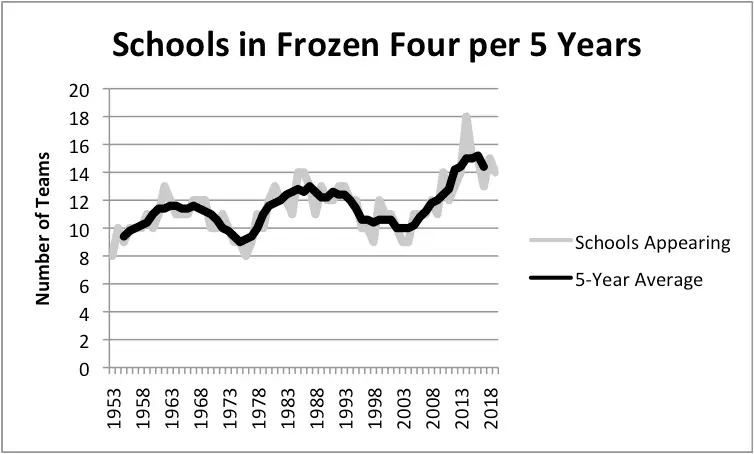 Figure 4:
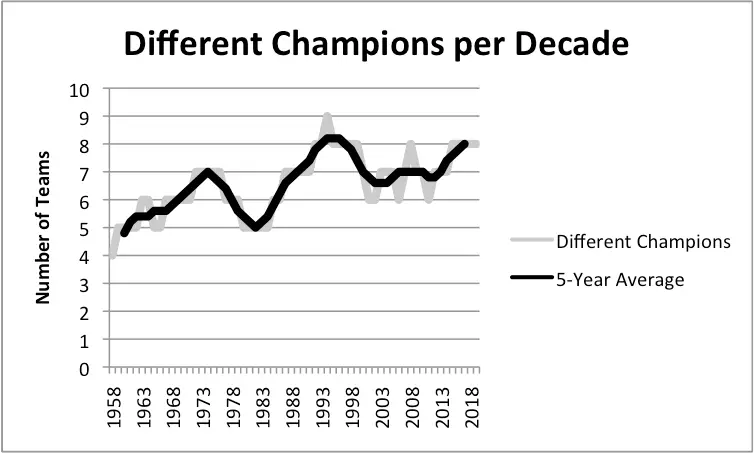 Figure 5:
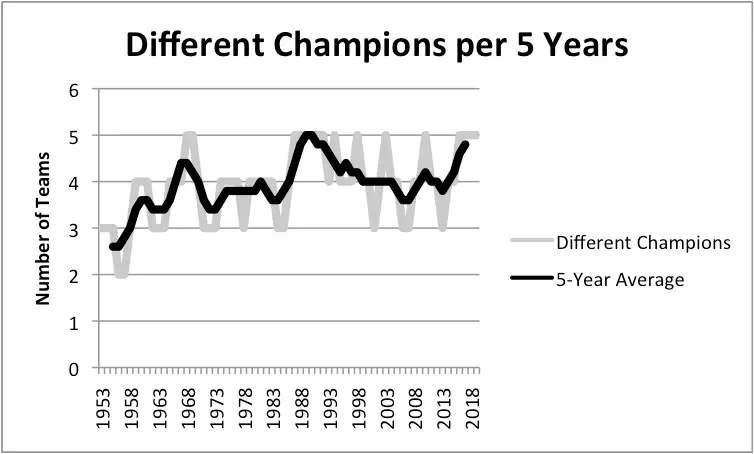 Figure 6:
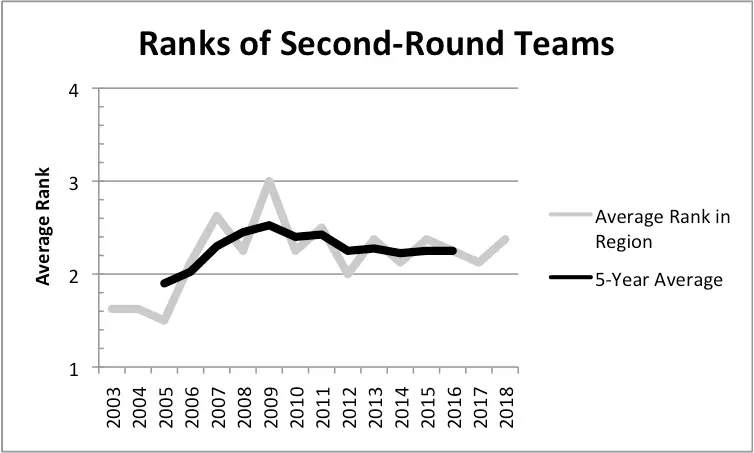 Figure 7:
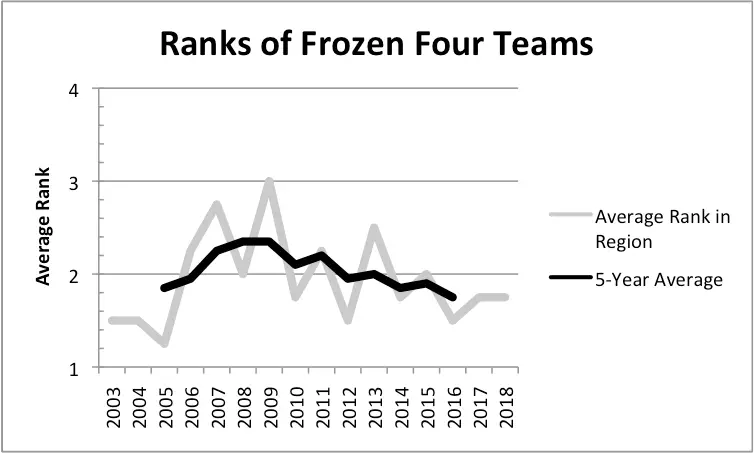 P. A. Jensen is a freelance sportswriter and editor of RuralityCheck.com. He lives in northern Minnesota with his wife and son.
Comments are closed.